

Level 1 Python projects are projects you can build in 30 to 45 minutes. These projects are more logically complex than the Super Simple Python projects and/or use multiple libraries. We’ve covered a couple math projects in Super Simple Python like LCM, GCD, and Prime factorization. This is another math project, but Bifurcation is a way more complex concept that anything we’ve done so far.
In this post, we’ll be building out a bifurcation visualization. Bifurcation is the mathematical study of the topology of a given family of curves. It’s most commonly applied to the study of dynamical systems. Dynamical systems is the study of how the location of a point in geometrical space changes over time.
In this post we’ll be creating a bifurcation diagram using a logistic map. Note that the logistic map function is NOT the same function we use in Logistic Regression. That function is the sigmoid function. The logistic map function looks like:


In order to do this tutorial, you’ll have to install two libraries, numpy, and matplotlib. You can install both by running the following command in your terminal:
pip install numpy matplotlibLogistic Map Function
Let’s start off by importing our libraries. We’ll import numpy as np and matplotlib.pyplot as plt. The “as” keyword simply lets us refer to the libraries using these aliases. Why do we do this? It’s just a convention.
After the imports, let’s create our logistic map function. The function will take two inputs, r, and x, both are expected to be floats. It will simply return the function we showed above.
import numpy as np
import matplotlib.pyplot as plt

def logistic(r:float, x:float):
    return r*x*(1-x)
Bifurcation Function and Plot
Now that we have our helper function, logistic, done, we can build our bifurcate function. This function will take five parameters. The seed parameter is our starting seed, the n_skip parameter will dictate how many iterations we skip, the n_iter function will determine how many iterations we show, the step parameter is the step size, and the r_min parameter is the minimum value we’ll show on our graph. Note that technically a bifurcation diagram does not show a function, but a relation.
We’ll start off our function by creating two empty lists for the x and y values and a range defining the range of our x-values. The np.linspace function is a numpy tool for creating numeric sequences. In this case, we’ll have a sequence of numbers from r_min to 4 with 1/step entries. Now we’ll loop through all the x values in that range. We start by setting y equal to the seed and then we’ll loop through the desired number of iterations. In this loop, we’ll only append to the list of x and y values only if we’re above the number of desired skipped iterations. At each iteration, including the skipped ones, we reset y to the logistic mapped value of x and y.
After we finish both loops, we’ll plot the values. In the plot function, ls is the line style, marker is the marker type, and color indicates the color. The xlim and ylim parameters define the x and y limits on the graph. Finally, we simply show the graph.
def bifurcate(seed:float, n_skip:int, n_iter:int, step:float=0.0001, r_min:float=0.0):
    X = []
    Y = []
    _range = np.linspace(r_min, 4, int(1/step))
    for x in _range:
        y = seed
        for i in range(n_skip+n_iter+1):
            if i >= n_skip:
                X.append(x)
                Y.append(y)
            y = logistic(x, y)

    plt.plot(X, Y, ls='', marker=',', color='black')
    plt.ylim(0, 1)
    plt.xlim(r_min, 4)
    plt.show()
Now let’s run our function.
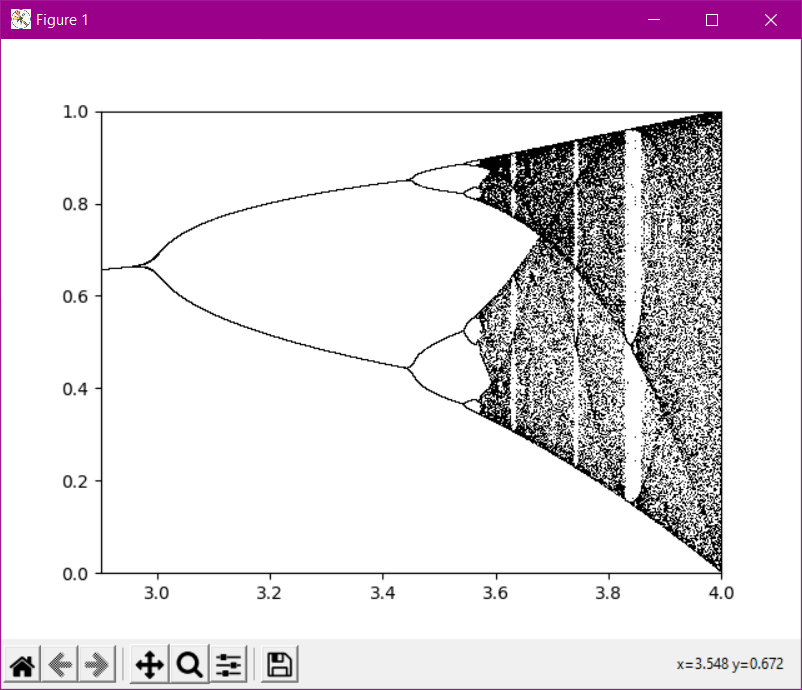
bifurcate(0.2, 100, 10, r_min=2.9) If we bifurcate with a seed of 0.2, 100 skipped iterations, and 10 actual iterations, starting from x=2.9 as shown above, we’ll see the image below.

I run this site to help you and others like you find cool projects and practice software skills. If this is helpful for you and you enjoy your ad free site, please help fund this site by donating below! If you can’t donate right now, please think of us next time.

