
Have New York Times News Headlines gotten more negative since the beginning of COVID? Let’s use Artificial Intelligence (AI) to find out. I think the answer should be yes, the media is designed to capture attention by inspiring fear in us. However, I’m also a big fan of the New York Times, so I hold a glimmer of hope. Natural Language Processing (NLP) is the branch of AI that deals with language, so we’ll use State of the Art NLP techniques to find out. How can we do this? TL;DR Findings
- Sign up for New York Times API
- Pull archived headlines from the New York Times
- Use The Text API to measure Text Polarity
- Graph our findings
Let’s get into it. Getting signed up for the New York Times API is pretty easy, just go to their Get Started Page and follow their provided instructions. For this tutorial specifically, when you set up your “App”, make sure you enable the Archive API like I’ve shown below.

Make sure you copy and save your API key somewhere safe. I’ve marked my API key out in blue in the image below.

That’s all there is to Step 1, signing up for the New York Times API, let’s get into the code.
Pull Archived Headlines From the New York Times
The first thing we’re going to do is pull the archived headlines from the NY Times with their API. To do this, we’ll need to install the requests library in order to make HTTP requests.
pip install requestsThe first file we’ll make is a file to handle calling the archive. We’ll title this file archive.py and start off with our imports. We’ll import the requests library for HTTP requests, the json library for JSON parsing, os for making directories if we need to, and remember the API key we copied from the NY Times API page? Let’s import that as well.
import requests
import json
import os
from config import public_key
Now let’s set up a dictionary to map the month number to the month name. Why are we doing this? This is due to the format of the URL to retrieve archived articles, which we’ll see in a moment. This will also help us retrieve entire years of archived titles in one function call.
month_dict = {
    1: "January",
    2: "February",
    3: "March",
    4: "April",
    5: "May",
    6: "June",
    7: "July",
    8: "August",
    9: "September",
    10: "October",
    11: "November",
    12: "December"
}
Now let’s define our central function for this document. Let’s call it get_month and give it the parameters year and month because we’re going to use it to get the archive information for a given year and month. In this function the first thing we’re going to do is construct the URL from our input and send a GET request to the URL. Load our response into text format, and then parse it with JSON. We’ll wrap this in a try-except block so that if it fails, we simply tell the user that the requested month was not in the archive and return.
Next, we’ll create a folder for the year if it doesn’t exist yet and declare our file name. You are free to set the filename to whatever you want. I chose the format of “year/month.json” for ease of access and clarity of title. You can actually skip this next part if you want to retain all the information returned from the archive call, but I put this in to get rid of superfluous information. Let’s create a list so that we can save the information from News articles only. While we loop through the returned documents, we’ll also get rid of the multimedia information, the _id, and the uri. Finally, we save our list to a JSON file.
def get_month(year, month):
    try:
        url = f"https://api.nytimes.com/svc/archive/v1/{year}/{month}.json?api-key={public_key}"
        res = requests.get(url)
        json_dict = json.loads(res.text)
	  # print(docs[0].keys())
        docs = json_dict["response"]["docs"]
    except:
        print("Requested month not in archive")
        return
    try:
        os.mkdir(year)
    except:
        pass
    filename = f"{year}/{month_dict[month]}.json"
    # print(filename)
    # get types_of_material = "News" only
    # get document_type = "article" only
    new_docs = []
    for doc in docs:
        if doc["type_of_material"] == "News" and doc["document_type"] == "article":
            doc.pop("multimedia")
            doc.pop("_id")
            doc.pop("uri")
            new_docs.append(doc)


    with open(filename, "w") as f:
        json.dump(new_docs, f)
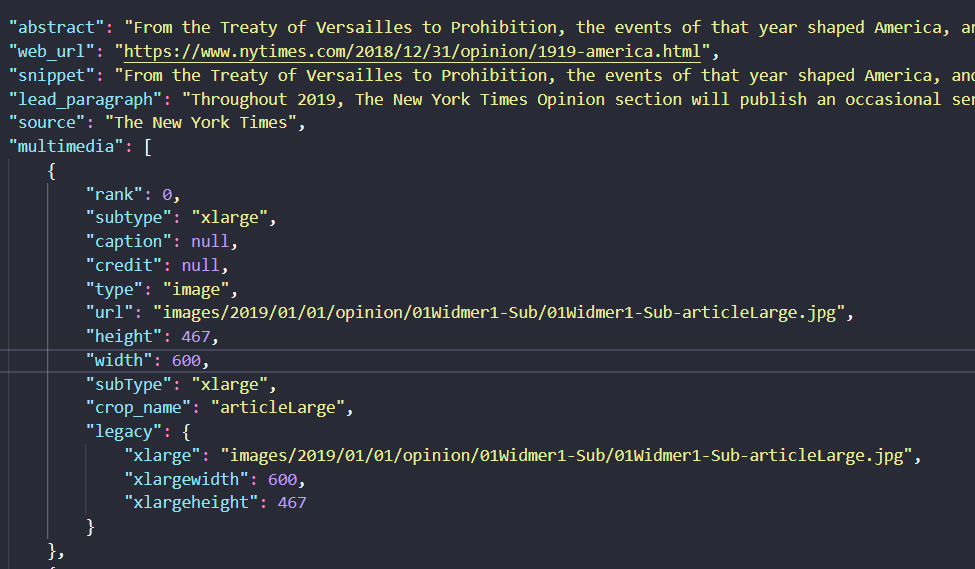
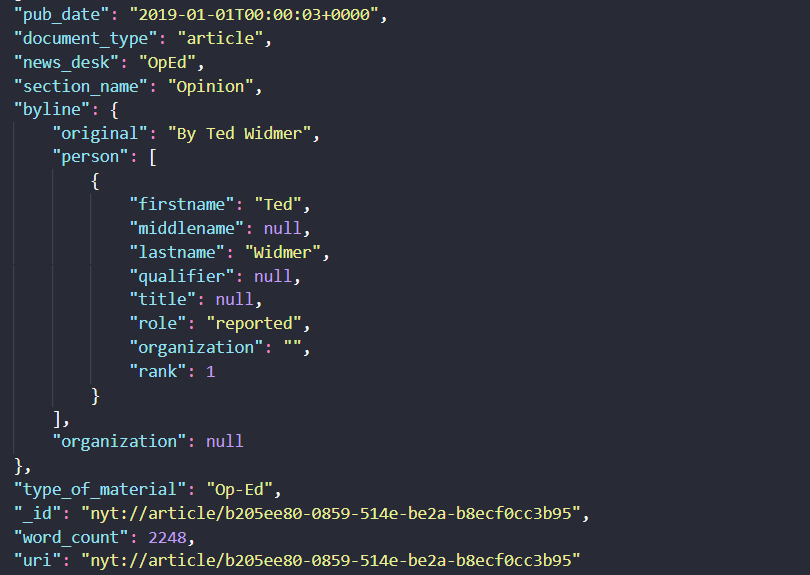
For reference, here are the keys to each document in the response:

Here’s what the JSON looks like:

The other two functions we’ll define are a function to get a whole year, and a function to get multiple years. Our get_year function will take in a year and call the get_month function we created above for each month in that year. Notice that range starts at 0 and is a closed range function, which means we won’t actually hit the number 12 in the call to range(12). Our get_years function will take a list of years and call the get_year function for each of those years.
def get_year(year):
    # range(12) goes from 0 to 11
    for i in range(12):
        get_month(year, i+1)

def get_years(years):
    for year in years:
        get_year(year)
Now let’s make a separate file to actually orchestrate these downloads. I called mine downloader.py. This file is pretty simple, all we do is import our get_years function from the archive and then create a function to call it and download the archive. Our function will prompt the user to put in a comma separated list of years, which it reads as a string (so don’t put spaces between commas and years!). Then it will split that string and call get_years on each year in that list. After we define our function, to actually use it, we’ll just call it at the end of the file.
Note: the downloader.py file doesn’t actually contain the code to download the files, we did that in archive.py, but this is the file we’ll be using to call our functions – this is to increase our code modularity
from archive import get_years

def download():
    years = input("Which years do you want? Enter a Comma Separated List.\n")
    yr_list = years.split(",")
    print(yr_list)
    get_years(yr_list)

download()
Use The Text API to Measure Text Polarity
Now that we’ve created our files for pulling archived information from the NY Times, let’s analyze the titles for their polarity scores. We’ve already installed the requests library above, so we won’t need to install any extra libraries! We simply go to The Text API and sign up for a free API key. After we’ve signed up for an API key, we can get into the program.
We’ll start by importing the libraries we need, json to parse the JSON data, and requests to send HTTP requests. I’ve also imported the API key from my config file and the month_dict we created in our archive.py file earlier to convert the month number to the month name. Then we set up our request to The Text API, we’ll pass in the API key through the headers.
import json
import requests
from archive import month_dict
from config import thetextapikey

headers = {
    "Content-Type": "application/json",
    "apikey": thetextapikey
}
url = "https://app.thetextapi.com/text/polarity_by_sentence"
Now we’ll make a function that takes a year and a month, just like the get_month function we made earlier. This function will get the polarity of the data we pulled for that month. First, we’ll construct our filename and open our function. We’ll enclose it in a try-except block just in case the file doesn’t exist. Now we’ll bundle all the headlines into different sentences and create the body of the request we’re going to send to the url endpoint we created earlier. When we get the request back, we’ll parse it into a dictionary and write that to a JSON.
def get_polarity(year, month):
filename = f"{year}/{month_dict[month]}.json"
try:
with open(filename, "r") as f:
entries = json.load(f)
except:
print("No such file")
return
headlines = ""
for entry in entries:
headline = entry['headline']['main']
headline = headline.replace('.', '')
headlines += headline + ". "
body = {
"text": headlines
}
res = requests.post(url, headers=headers, json=body)
print(res.headers)
_dict = json.loads(res.text)
with open(f"{year}/{month_dict[month]}_Polarity.json", "w") as f:
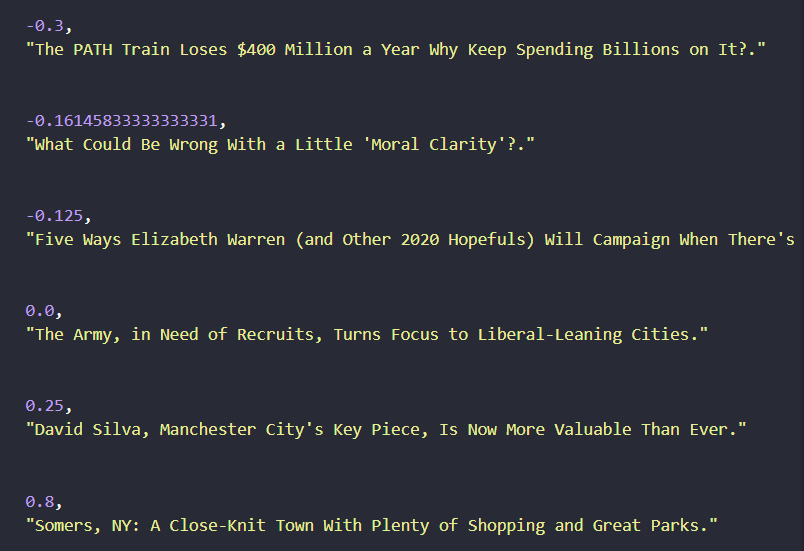
json.dump(_dict["polarity by sentence"], f)Now we run get_polarity on all the years and months that we want to run it on and the program will save a JSON document for us. It’ll look like the image below. Just a heads up, you’ll have to let these programs run for a bit, each NY Times archive is over 1 MB in size!
Graph Our Findings
Alright, now that we’ve done all this work, let’s get some results! We’ll start by plotting our data and taking a look at what it should look like. First, we’ll need to install the matplotlib library so that we can plot our findings.
pip install matplotlibThat’s the only library we need, now let’s get into our Python program. We’ll start by importing the libraries we need. We’ll import matplotlib.pyplot to plot our data, we import it as plt simply by convention. Then we’ll import json to parse our JSON file. Finally, we’ll import the month_dict we created earlier so that we can parse the numbers as months.
import matplotlib.pyplot as plt
import json

from archive import month_dict
The next thing we’ll do is make a function that will get our monthly averages. We’ll pass it three parameters, a year, a month, and a month_avgs list that will track our month’s polarity over time. Our function will start by opening up our file and loading the JSON. Then we simply loop through all of our entries and add the polarity values to a list. At the end of adding everything to the list, we’ll append the average to our month_avgs list.
def get_avg(year, month, month_avgs):
    filename = f"{year}/{month_dict[month]}_Polarity.json"
    with open(filename, "r") as f:
        entries = json.load(f)
    ys = []
    for entry in entries:
        ys.append(entry[0])
    month_avgs.append(sum(ys)/len(ys))
Now that we’ve set up our function, we’ll simply loop through every month (up to November 2021) and get the average polarity of that month. Once we have the average polarity of all the months, we simply plot the number of months since January 2019 vs the average polarity of news headlines that month by splitting the index and polarity into two lists and calling plt to plot them. After plotting them, I also give the x-axis a label, the y-axis a label, and the graph a title.
month_avgs = []
for year in [2019, 2020, 2021]:
    for month in range(1, 13):
        if year == 2021 and month > 10:
            continue
        get_avg(year, month, month_avgs)

xs = []
ys = []
for index, month in enumerate(month_avgs):
    xs.append(index)
    ys.append(month)
plt.plot(xs, ys)
plt.xlabel("Months since Jan 2019")
plt.ylabel("Polarity Score")
plt.title(f"NY Times Avg Headline Polarity by Month")
plt.show()
Lit, now let’s take a look at our graph:
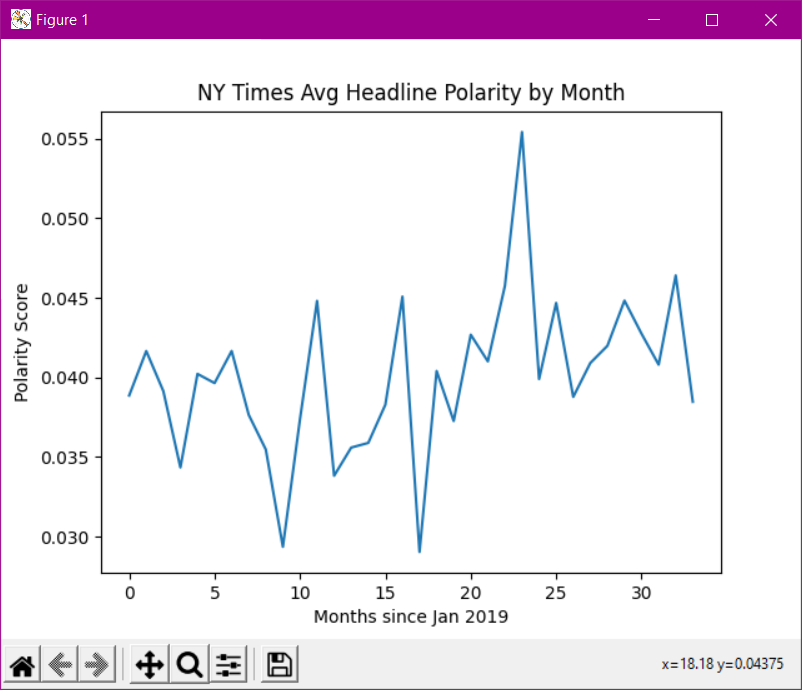
WHAT??? It looks like it’s pretty stable around an average polarity of 0.04 every month. There are a few months that look kind of out of place, 9 months (low), 17 months (low), and 23 months (high) after January of 2019. That translates to the lowest polarities in October 2019, June 2020, and December 2020. In our next article we’ll take a deeper dive into those months. Our overall answer is – NO. COVID has not made NY Times article headlines more negative!
I run this site to help you and others like you find cool projects and practice software skills. If this is helpful for you and you enjoy your ad free site, please help fund this site by donating below! If you can’t donate right now, please think of us next time.

2 thoughts on “Ask AI: Has COVID Made NY Times Headlines More Negative?”